DunedinPACE: Measuring the Speed of Ageing
Most epigenetic clocks read the odometer. This one claims to read the speedometer, from a single blood sample and twenty years of other people's roads.
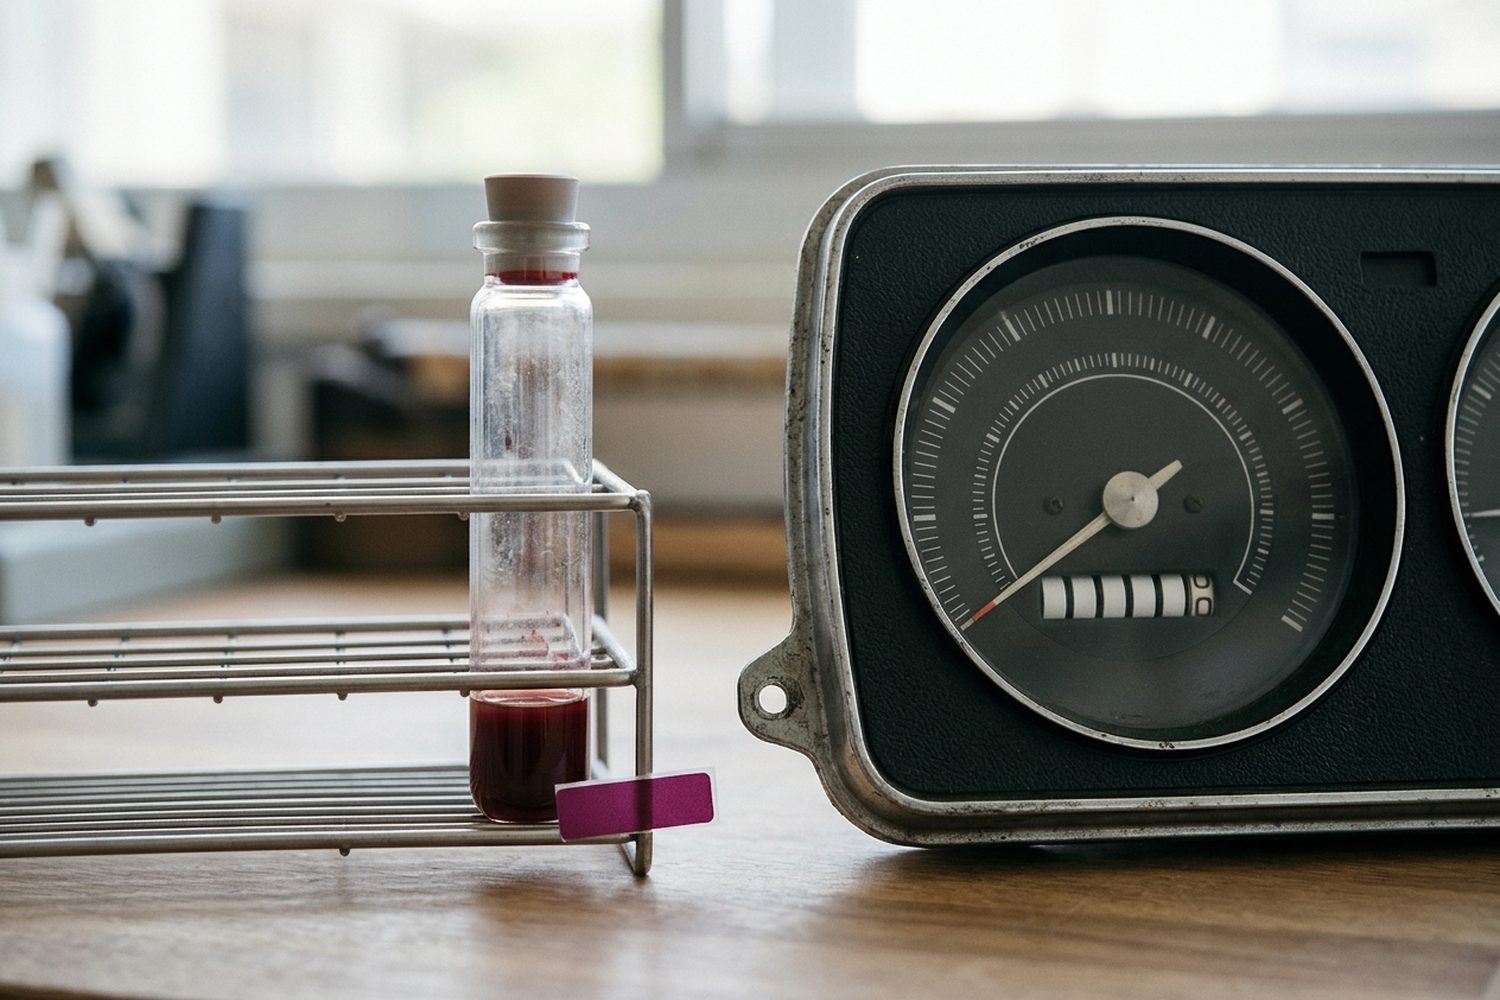
There is a blood test that does not tell you how old you are. It tells you how fast you are getting older, which is a different number and a more personal one.
The test is DunedinPACE, a DNA methylation measure built from one group of people born in 1972 and 1973, whose bodies were measured over and over for two decades. Most epigenetic clocks read chemical tags on your DNA and output an age in years. This one reads the same kind of tags and outputs a rate: how quickly the body’s systems are wearing down, relative to the calendar. Researchers sometimes call it a “third generation” clock because, unlike the generations before it, it was trained on change over time rather than on a snapshot.
What the clock measures instead of an age
The older clocks (the site covers them elsewhere) were mostly built by taking blood from people of many ages and teaching an algorithm to guess each person’s age from their methylation. That works. It also mostly teaches the algorithm to be a very expensive birth certificate.
The pace clock was built differently. The Scientist describes third-generation clocks as “trained on differences in multi-organ system deterioration between individuals of the same age.” The target was never “how old is this person.” It was “among people who are exactly the same age, who is falling apart faster.” Papers on Alzheimer’s markers put it plainly: the measure captures the pace of biological aging rather than a static biological age estimate.
The objection: isn’t a speed just two ages?
Here is the sensible reaction. A speed is distance divided by time. If an age clock says your body is 40 now and 42 a year from now, you aged two years in one. Why do you need a separate clock for that? Just take two readings and subtract.
To be fair, that is how speed works. But consider an invented case. A man (call him Gary, he is not real) takes an age test every month. Any measurement wobbles a little, so his readings go 51, 47, 53, 49. Subtracting, he aged four years in January, reversed four years in February, aged six in March. By summer he is Benjamin Button with a mortgage (Gary would like a word with the lab). Subtraction amplifies wobble.
The pace clock does something stranger than subtraction. It produces a speed from a single blood draw. It is a radar gun that works on a photograph. That sounds impossible, and in some sense the whole design of the study exists to make it possible.
How the Dunedin Study built a speedometer
The trick is the cohort. Everyone in the Dunedin Study was born in the same 1972 to 1973 window, so at every visit they were all the same age. That removes the usual problem. If two 38-year-olds differ, age cannot be the reason, because they have the same one.
So the researchers measured. The eLife paper describes tracking “within-individual decline in 19 indicators of organ-system integrity across four time points spanning two decades,” at ages 26, 32, 38 and 45. Each person got a personal slope: how fast their 19 indicators slid over those years. That slope is the Pace of Aging. Then the algorithm was trained to find the methylation pattern in a single blood sample that matched each person’s slope.
I assume the logistics were less elegant than the math. “Great, thanks for coming in, see you when you’re 32” is a sentence somebody presumably said to a 26-year-old, and then meant it. (Richie Poulton, whose role in the Dunedin Study is reflected in his co-authorship of the paper, was one of the people meaning it.)
This was the second attempt. A 2020 paper by Belsky and colleagues first showed that pace could be estimated from a methylation blood test, using a version called DunedinPoAm, which modeled change in 18 biomarkers over ages 26 to 38. The later version added a 19th indicator and a fourth time point. Same idea, longer road.
How well does the photograph match the road? The pace score correlates with the 20-year Pace of Aging at r = 0.78. The paper also checked it against functioning at age 45: physical change between the age-38 and age-45 visits, and cognitive change all the way from an age-13 baseline. Thirty-two years. That is a long time to wait for a data point. The clock was then tested in five additional datasets, and its developers’ lab page says it has been validated in more than 65 large cohorts and reported in more than 300 publications, which is more papers than I have read about anything, including the things I write about.
What a faster or slower DunedinPACE has been linked to
The Moffitt & Caspi lab page calls it “the most sensitive epigenetic clock to intervention.” The main evidence for responsiveness is the CALERIE trial, where 25% caloric restriction over 2 years slowed the pace by about 3%, in a post-hoc analysis, while PhenoAge and GrimAge did not change significantly. That is a modest number, which is part of why it is interesting. Separately, a 3% slower pace has been associated with about 15% lower risk of death in an independent study of older adults. Whether the first number buys you the second is not settled. (Those are two different groups of people, which matters.)
Then there is the number that stops you. In a study of people with well-controlled HIV, all 17 individuals who died had a baseline value greater than 1. All 17, every one of them above the same line, measured before anything happened. It is a small group, and a small group can line up neatly by chance. But it is the kind of tidy that makes a statistician put down their coffee.
Other results are quieter. In the WHIMS study, higher baseline pace went with faster rises over 15 years in plasma markers tied to Alzheimer’s disease. In men with heart and metabolic problems, GrimAge and the pace clock picked up those diseases while none of 19 first-generation clocks did. In Add Health, lifestyle and sociodemographic factors showed up more often in clocks like this one than in clocks trained on age alone. In a Parkinson’s cohort that computed seven different clocks, the pace clock was the one linked to rigidity in women. (Running seven clocks on the same blood is the research version of asking every friend for directions.)
How to read a pace number, and what is not settled
Look, a speed is a slippery thing to hold. A frailty meta-analysis found that a higher pace went with more frailty at a single point in time (5 studies, 7,895 people, a standardized effect of 0.10), but with heterogeneity of 91%, which is the statistical way of saying the studies sort of disagreed with each other. Followed over time, the pace did not significantly predict rising frailty. GrimAge did, barely.
So what is one reading worth? I don’t know, and the literature does not quite know either. It is an estimate, made from one moment, of a slope that took the original cohort twenty years to draw. That is impressive. It is also an inference about the past being sold as a reading of the present.
The clock has also left the lab. TruDiagnostic’s TruAge combines it with two other clocks, as part of a report covering 64 biomarkers. A clock goes from a citation, to a collaboration, to a product page, and the line between a measuring instrument and a dashboard you check over breakfast gets a little blurry.
Other fields want the same trick, for instance Brain-PACE, an MRI method posted in September 2026 that estimates the pace of brain aging from paired scans. Everyone would like a speedometer.
Most clocks read the odometer. This one reads the speedometer, off one blood sample, using twenty years of other people’s roads. It does not know where you are going.
It knows how fast.
Sources
- Figures and data in DunedinPACE, a DNA methylation biomarker of the pace of aging | eLife
- DunedinPACE, a DNA methylation biomarker of the pace of aging | eLife
- DunedinPACE | Moffitt & Caspi: Genes, Environment, Health, Behavior
- Epigenetic clocks and longitudinal plasma biomarkers of Alzheimer's disease
- Epigenetic clocks and longitudinal plasma biomarkers of Alzheimer's disease
- Effect of long-term caloric restriction on DNA methylation measures of biological aging in healthy adults from the CALERIE trial
- Prognostic Value of Blood Epigenetic Biomarkers of Aging in Persons With Well-Controlled HIV-1 Infection
- The Sociodemographic and Lifestyle Correlates of Epigenetic Aging in a Nationally Representative U.S. Study of Younger Adults
- Biological age measured by DNA methylation clocks and frailty: a systematic review and meta-analysis
- Epigenetic Clocks Power Biological Age Data, But Why Do Results Differ Across Tests? | The Scientist
- Associations of Epigenetic Age Acceleration with Motor Impairment: Evidence from the PPMI Cohort
- About TruAge
- TruDiagnostic™ Biological Age Test
- EFFECT OF LONG-TERM CALORIC RESTRICTION ON THE PACE OF BIOLOGICAL AGING IN HEALTHY ADULTS FROM THE CALERIE TRIAL
- Epigenetic signatures of cardiometabolic risk in men: accelerated aging and differential methylation replicated across cohorts
- Quantification of the pace of biological aging in humans through a blood test, the DunedinPoAm DNA methylation algorithm | eLife
- [2609.11378v1] Brain-PACE: A Deep Siamese MRI Framework for Modelling Longitudinal Brain Acceleration
Bio Clock Test explains published research. It is not medical advice and it does not diagnose anything. We never recommend a test, a supplement or a treatment. Talk to a clinician about your health.